fbpx
  • Baku
  • info@solarwind.az

Sepetinizde ürün bulunmuyor.

Məhsullar
Read More

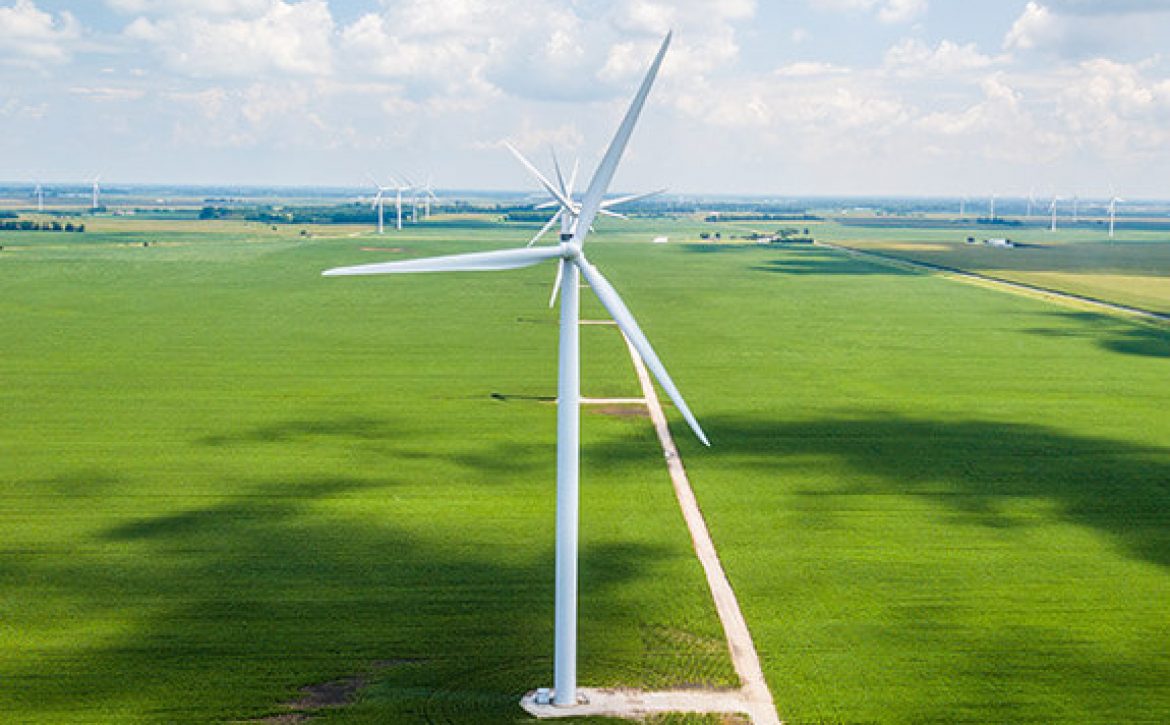
Onshore technology continues to dominate wind capacity growth, but offshore is expected to increase its share in the coming years

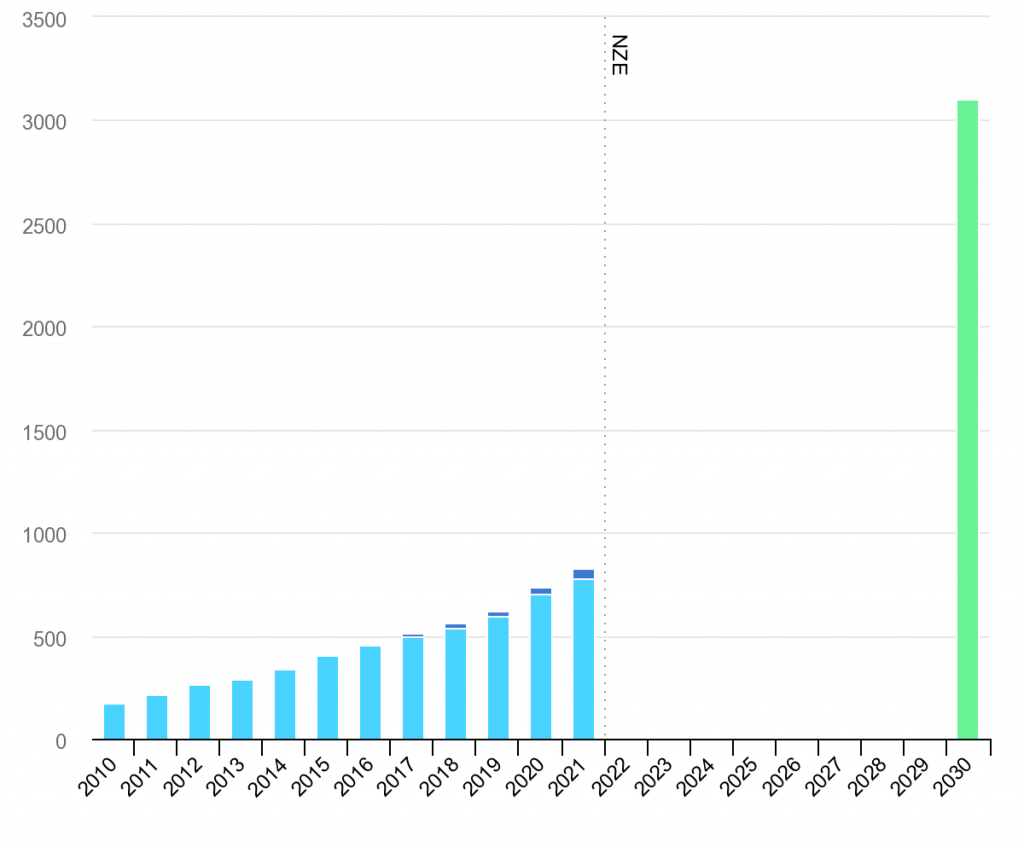
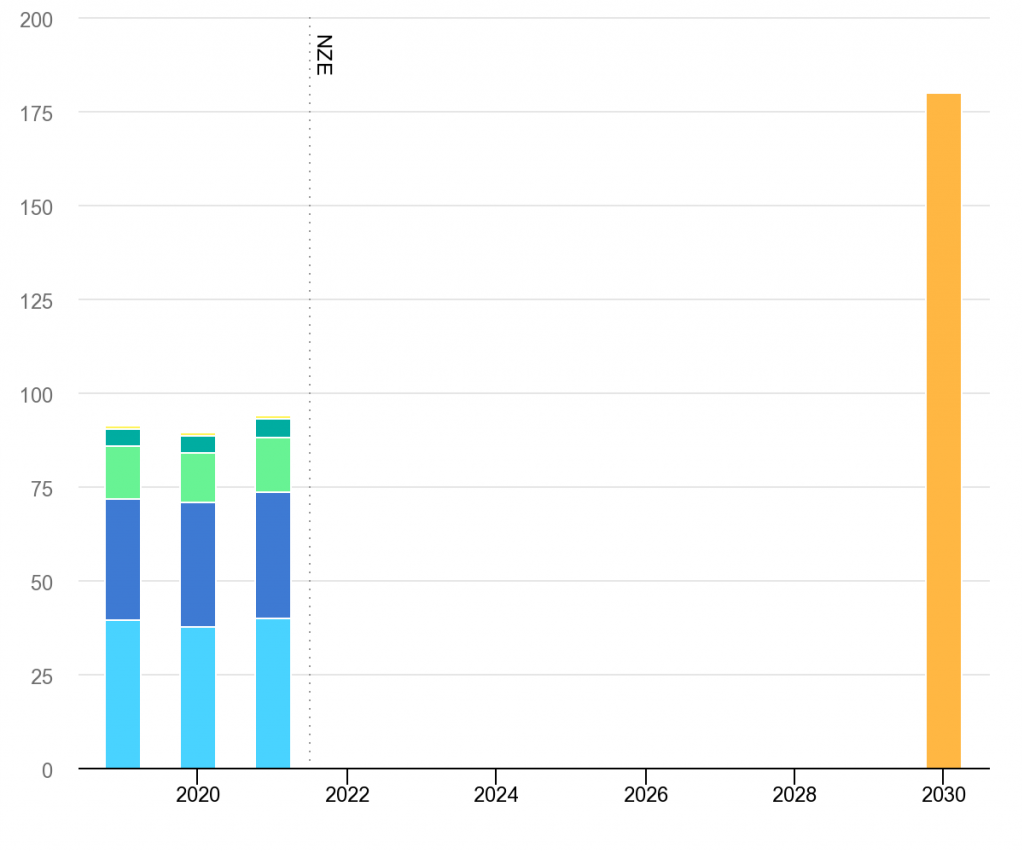
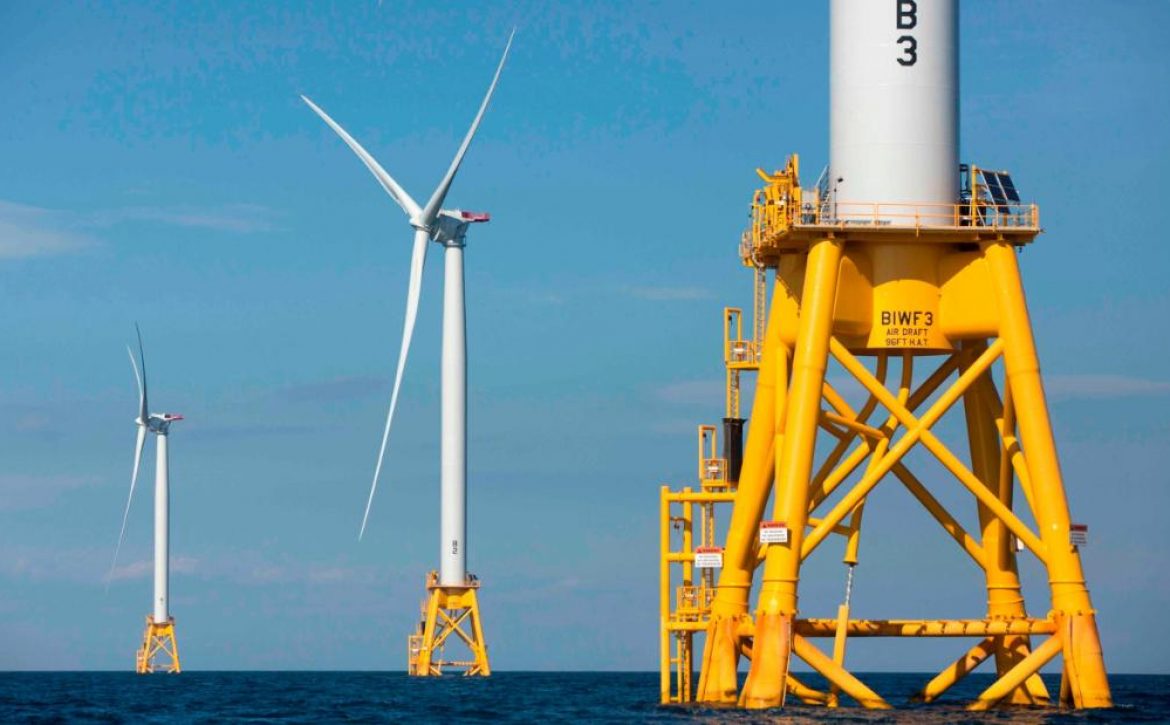
In 2021, of the total 830 GW of wind capacity installed, 93% were onshore systems, with the remaining 7% offshore wind farms. Onshore wind is a developed technology, present in 115 countries around the world, while offshore wind is at the early stage of expansion, with capacity present in just 19 countries. However, offshore reach is expected to increase in the coming years as more countries are developing or planning to develop their first offshore wind farms.  

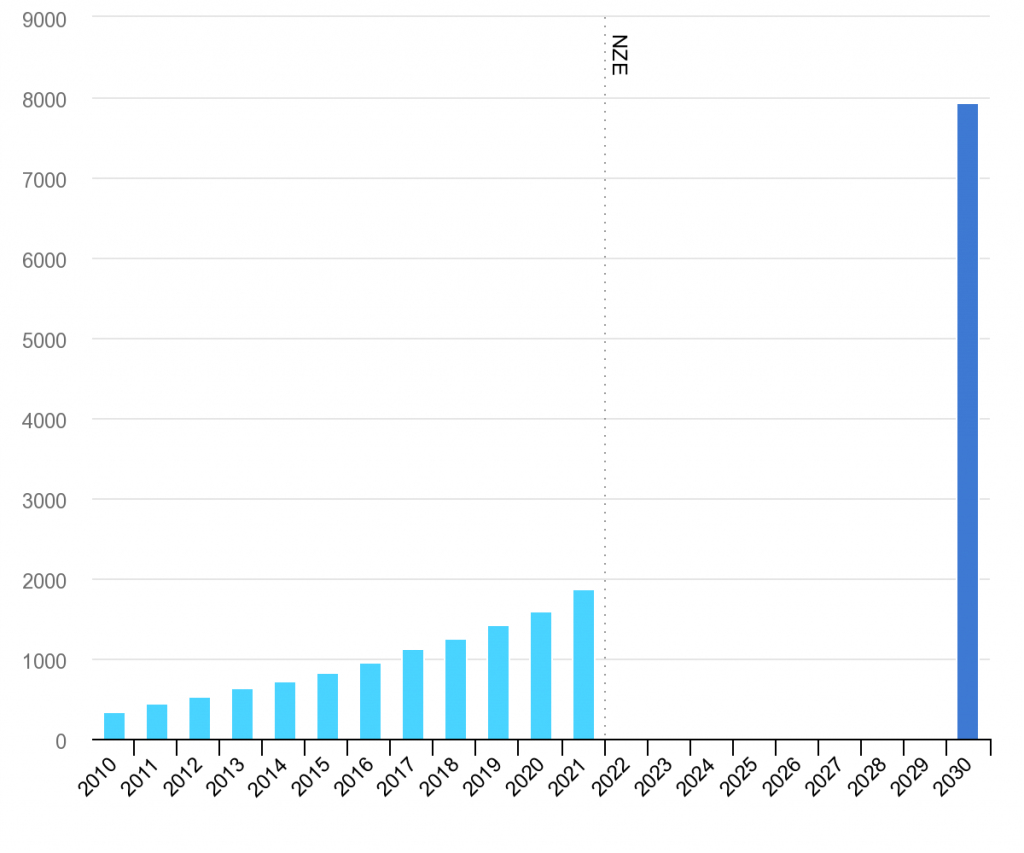
Wind power capacity in the Net Zero Scenario, 2010-2030

Read More

Pumped-storage hydropower is still the most widely deployed storage technology today, but grid-scale batteries are catching up

Grid-scale storage plays an important role in the Net Zero Emissions by 2050 Scenario, providing important system services that range from short-term balancing and operating reserves, ancillary services for grid stability and deferment of investment in new transmission and distribution lines, to long-term energy storage and restoring grid operations following a blackout.

Pumped-storage hydropower is the most widely used storage technology and it has significant additional potential in several regions. Batteries are the most scalable type of grid-scale storage and the market has seen strong growth in recent years. Other storage technologies include compressed air and gravity storage, but they play a comparatively small role in current power systems.

Annual grid-scale battery storage additions, 2016-2021

Read More
Woman charging electro car by her house

Electric car sales are accelerating, with China and Europe setting new records

Sales of electric cars reached another record high in 2021 despite the Covid-19 pandemic and supply chain challenges, including semiconductor chip shortages. Looking back, about 120 000 electric cars were sold worldwide in 2012. In 2021, that many were sold in a week.

EV markets are expanding quickly. Electric car sales accounted for 9% of the global car market in 2021 – four-times their market share in 2019. All the net growth in global car sales in 2021 came from electric cars. Sales were highest in China, where they tripled relative to 2020 to 3.3 million after several years of relative stagnation, and in Europe, where they increased by two-thirds year-on-year to 2.3 million. Together, China and Europe accounted for more than 85% of global electric car sales in 2021, followed by the United States (10%), where they more than doubled from 2020 to reach 630 000.

Global electric car stock, 2010-2021

Read More

Offshore wind has a remarkable potential

As a part of its Offshore Wind Outlook 2019, the IEA initiated new geospatial analysis to assess the technical potential of offshore wind by country. Its study showed that the best close-to-shore offshore wind sites globally could provide almost 36 000 TWh of electricity per year, which is very close to the global electricity demand projected for 2040. However, several challenges will have to be overcome for this enormous potential to be successfully exploited. Government policies will continue to be critical in determining to the future of offshore wind.

Offshore wind technical potential and electricity demand, 2018

Read More
Electric car power charging, Charging technology, Clean energy f

Global sales of EV’s nearly doubled from 2020, and must continue to increase to meet the Net Zero Scenario

Electric vehicles are the key technology to decarbonise road transport, a sector that accounts for 16% of global emissions.

Compared with 2020, sales nearly doubled to 6.6 million (a sales share of nearly 9%), bringing the total number of electric cars on the road to 16.5 million. The sales share of electric cars increased by 4 percentage points in 2021. Getting on track with the Net Zero Scenario requires their sales share to increase by less than 6% percentage points per year.

New zero-emission vehicle (ZEV) sales targets were announced in several markets and existing targets were intensified as governments demonstrated a strong commitment to incorporating the electrification of cars as a key component of strategies to meet net zero targets and nationally determined contributions.

Electric car registrations and sales share in China, United States, Europe and other regions, 2016-2021

Read More

Hydrogen is an increasingly important piece of the net zero emissions by 2050 puzzle

The key pillars of decarbonising the global energy system are energy efficiency, behavioural change, electrification, renewables, hydrogen and hydrogen‐based fuels, and CCUS. The importance of hydrogen in the Net zero Emissions Scenario is reflected in its increasing share in cumulative emission reductions. Strong hydrogen demand growth and the adoption of cleaner technologies for its production thus enable hydrogen and hydrogen based fuels to avoid up to 60 Gt CO2 emissions in 2021-2050 in the Net zero Emissions Scenario, representing 6% of total cumulative emissions reductions.

Cumulative emissions reduction by mitigation measure in the Net Zero Scenario, 2021-2050

Read More

Wind will grow faster than over the previous five years

Onshore wind additions through 2026 are set to be almost 25% higher on average than in the 2015-2020 period. Global onshore wind additions doubled in 2020, reaching an exceptional level of almost 110 GW. This was driven by an acceleration in China as developers rushed to complete projects before subsidies expired. While annual additions in the coming years are not expected to match 2020’s record, we forecast that they will average 75 GW per year over the 2021-2026 period.

Onshore wind capacity additions, actual and forecast by country/region, 2015-2026

Read More
Hydrogen energy storage gas tank in meadow environment.

Global hydrogen demand continues to grow but faster action is needed to reach Net Zero Emissions target by 2050

The momentum behind hydrogen remained strong over the past year. Nine countries – which cover around 30% of global energy sector emissions today – released their national strategies in 2021-2022.

On the supply side, electrolyser manufacturing capacity has doubled since last year, reaching nearly 8 GW per year; and the realisation of all the projects in the pipeline could lead to an installed electrolyser capacity of 134-240 GW by 2030, twice the expectations from last year.

Nonetheless, these laudable developments still are below what is needed to get on track with the Net Zero Emissions by 2050 Scenario. Faster action is required on creating demand for low-emission hydrogen and unlocking investment that can accelerate production scale up and deployment of infrastructure.

Global hydrogen demand by sector in the Net Zero Scenario, 2019-2030

Read More

Wind electricity increased a record amount, but more effort is needed

In 2021 wind electricity generation increased by a record 273 TWh (up 17%). This was 55% higher growth than that achieved in 2020 and was the highest among all renewable power technologies. Such rapid development was possible thanks to an unprecedented increase in wind capacity additions, which reached 113 GW in 2020, compared with just 59 GW in 2019.

However, to get on track with the Net Zero Emissions by 2050 Scenario, which has approximately 7 900 TWh of wind electricity generation in 2030, it is necessary to raise average annual capacity additions to almost 250 GW, more than double 2020’s record growth. Much greater efforts are needed to achieve this level of sustained capacity growth, with the most important areas for improvement being facilitating permitting for onshore wind and cost reductions for offshore wind.

Wind power generation in the Net Zero Scenario, 2010-2030

Read More

Solar PV still dominates renewable energy capacity additions despite rising prices

Even with surging commodity prices increasing manufacturing costs for solar PV, its capacity additions are forecast to grow by 17% in 2021. This will set a new annual record of almost 160 GW. Solar PV alone accounts for 60% of all renewable capacity additions, with almost 1 100 GW becoming operational over the forecast period in our main case, double the rate over the previous five years. In a significant majority of countries worldwide, utility-scale solar PV is the least costly option for adding new electricity capacity, especially amid rising natural gas and coal prices. Utility-scale solar projects continue to provide over 60% of all solar PV additions worldwide. Meanwhile, policy initiatives in China, the European Union and India are boosting the deployment of commercial and residential PV projects.

Renewable electricity capacity growth by technology, main and accelerated cases, 2015-2020 and 2021-2026

RussiaAzerbaijan